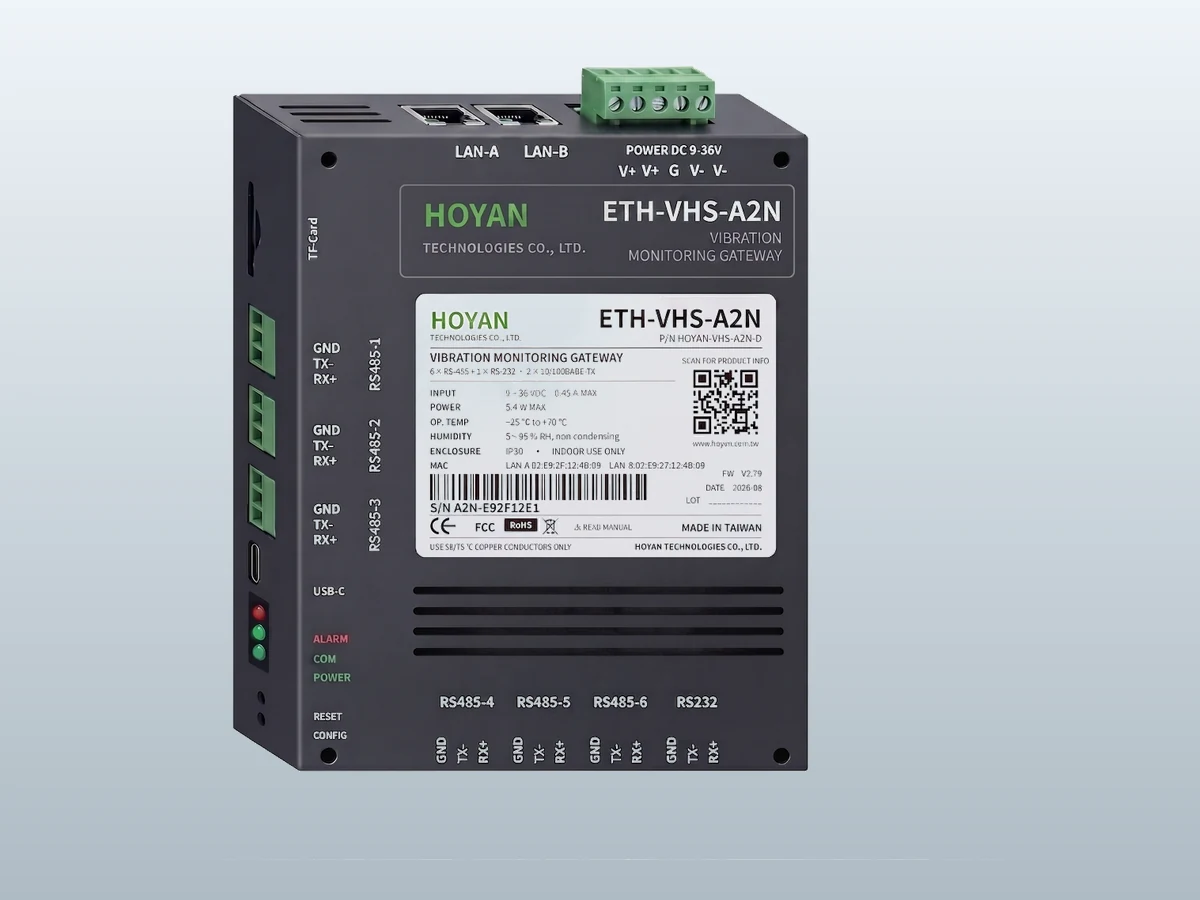
Gateway specifications
From reactive repair to predictive maintenance
Bearing and gear failures usually show symptoms weeks in advance, yet are found only through noise, heat or a stoppage — and unplanned downtime costs far more than the part itself. Predictive maintenance tracks the rate of degradation with quantified indicators and schedules repair before the zone becomes unacceptable, turning downtime from an accident into an appointment.
Sensors, gateway and host systems
Features are computed in the sensor, the ISO verdict is made in the gateway, and host systems consume results only. Each layer does its own job, so adopting condition monitoring does not mean rewriting the monitoring logic you already run.
The verdict is made at the edge
ISO zones and health scores are computed inside the gateway rather than handed upstream to be worked out later. That single choice drives the cost of adopting condition monitoring.
No host logic to rewrite
An existing SCADA only subscribes to results; no spectral processing logic has to be added. For a monitoring system that has been running for a decade, that is often the deciding factor.
Works when the network is down
The verdict does not depend on a cloud service or a host PC. The trend buffer and TF-card log keep accumulating through an outage, so the measurement record has no gaps.
Bandwidth spent on results
What travels northbound is zones, health scores and alarm events, not raw waveforms. Across plants or over a cellular link the difference is substantial.
Three-layer evaluation architecture
The ISO 10816 / 20816 series answers one question: is the overall vibration of this machine too high? It shows that a problem exists but not what it is. HOYAN-CBM adds a diagnostic layer on top of ISO and, just as importantly, states which layer is standard and which is engineering practice. The criteria set is held in internal flash and ships with the firmware — no TF card, no PC software, no extra licence.
Two blind spots of the overall-level method
An early fault does not raise the overall level: small bearing spalls produce impacts that are high in peak but low in energy, so RMS velocity barely moves — which is exactly why crest factor and kurtosis exist. The second blind spot is that the same overall level can have different causes: 3.0 mm/s may be unbalance, misalignment or looseness, and shaft-order rules (1× / 2× / 0.5×) are the cheapest way to tell them apart. L1 can indicate the conditions below, but the final verdict still rests with a qualified person interpreting trends and spectra.
Zone coverage and evaluation priority
Evaluation priority runs: custom threshold > the zone reported by the sensor > the 12 internal tables. The sensor value always wins; the internal tables are the fallback when the network is down or no zone is reported.
Health score 0 – 100
The score is mapped from each machine's own ISO zone boundaries rather than an absolute mm/s figure, so machines of different groups and sizes can be compared and ranked directly. It is a HOYAN management and overview indicator; the ISO series defines no such score, and the zone verdict with expert interpretation remains decisive.
No installation, no licence
A complete monitoring web application ships inside the gateway. A browser is all that is needed for live monitoring, trend enquiry, alarm handling and configuration. Traditional Chinese, Simplified Chinese, English and Japanese switch live, dark and light themes are both available, and a kiosk full-screen mode suits a wall display on the plant floor.
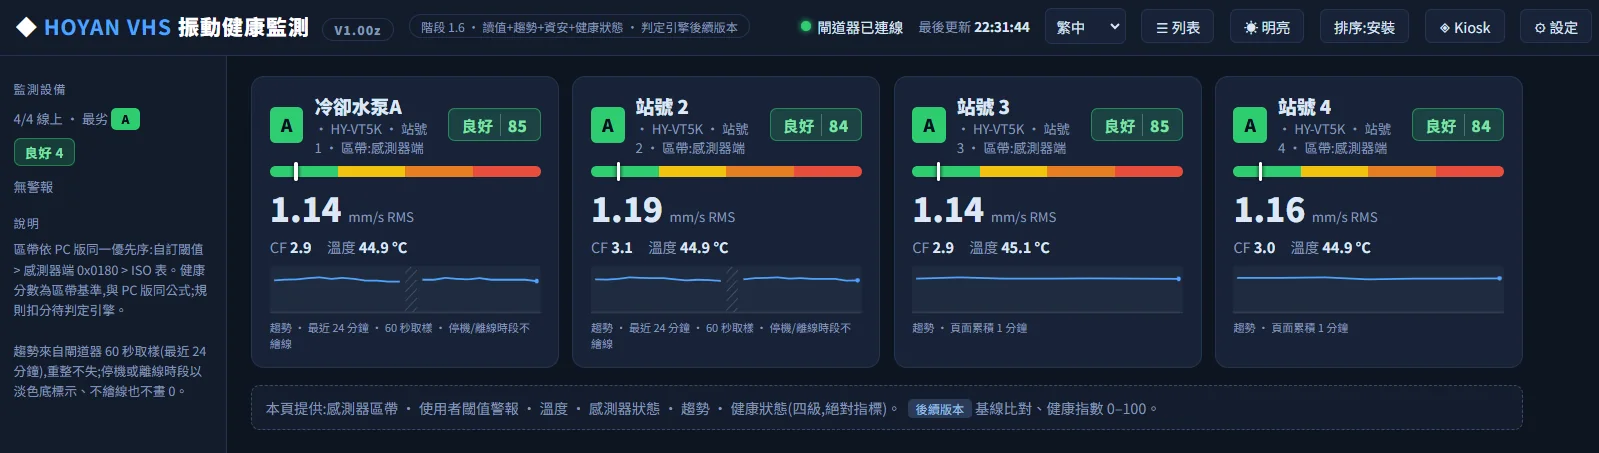
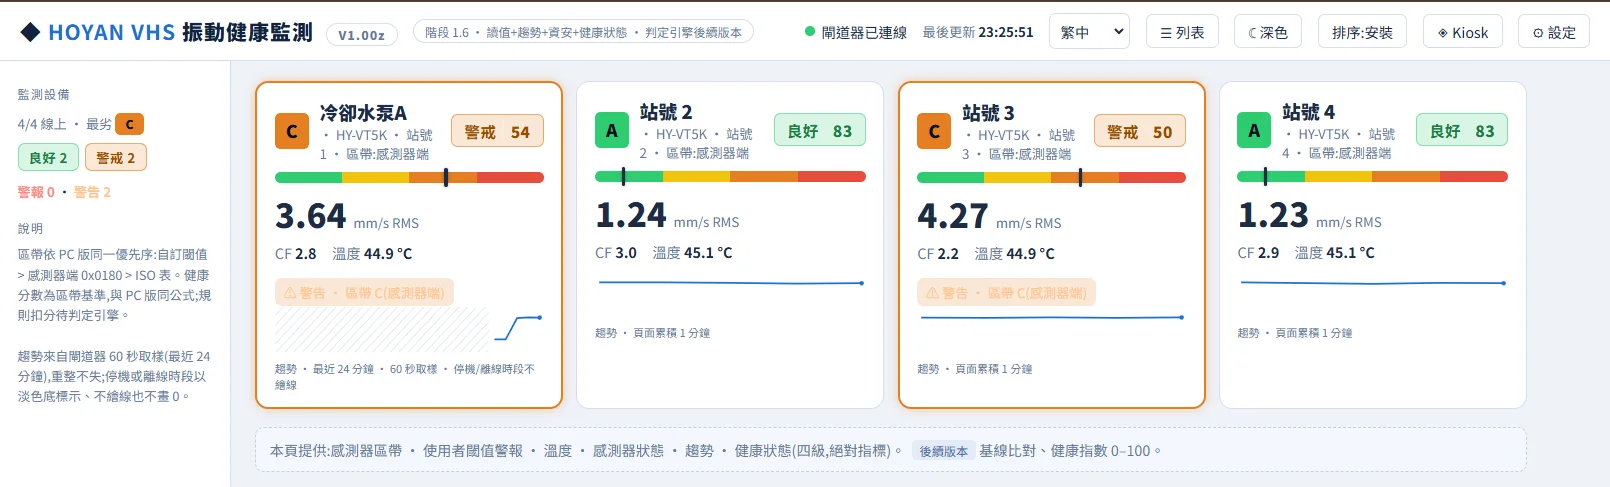
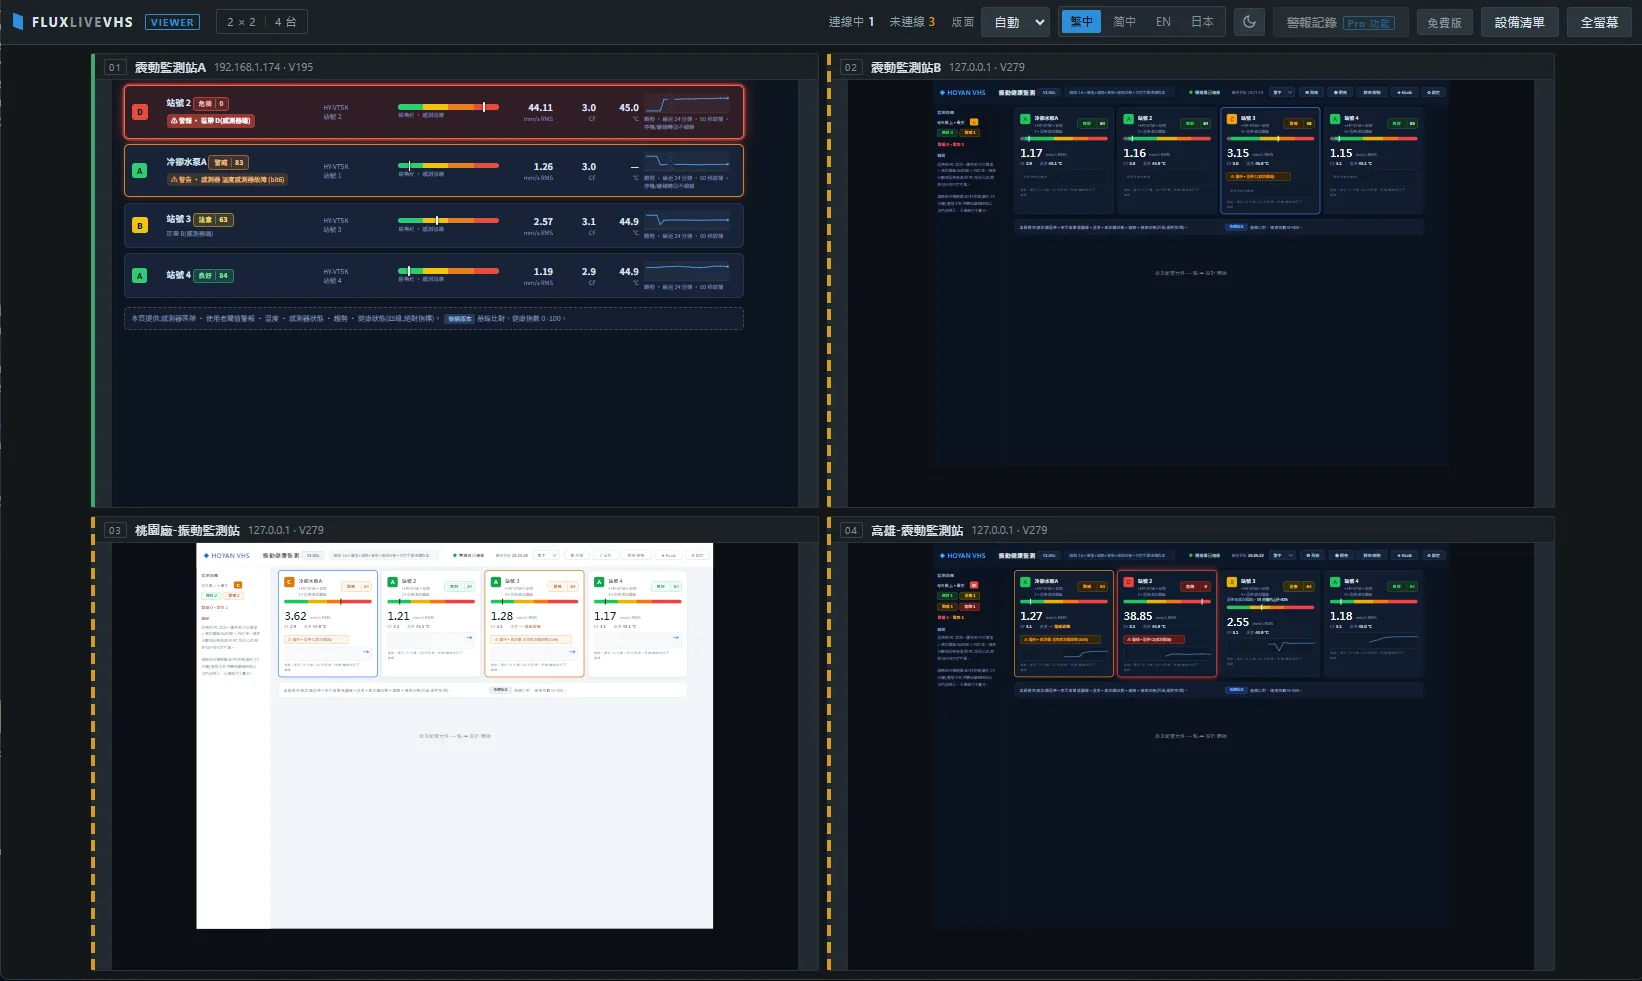
Three tiers of monitoring and analysis
One gateway needs only the built-in interface. Add the multi-station viewer when there are several, and the desktop application only when diagnosis is required. Each tier is added as the need appears rather than bought up front.
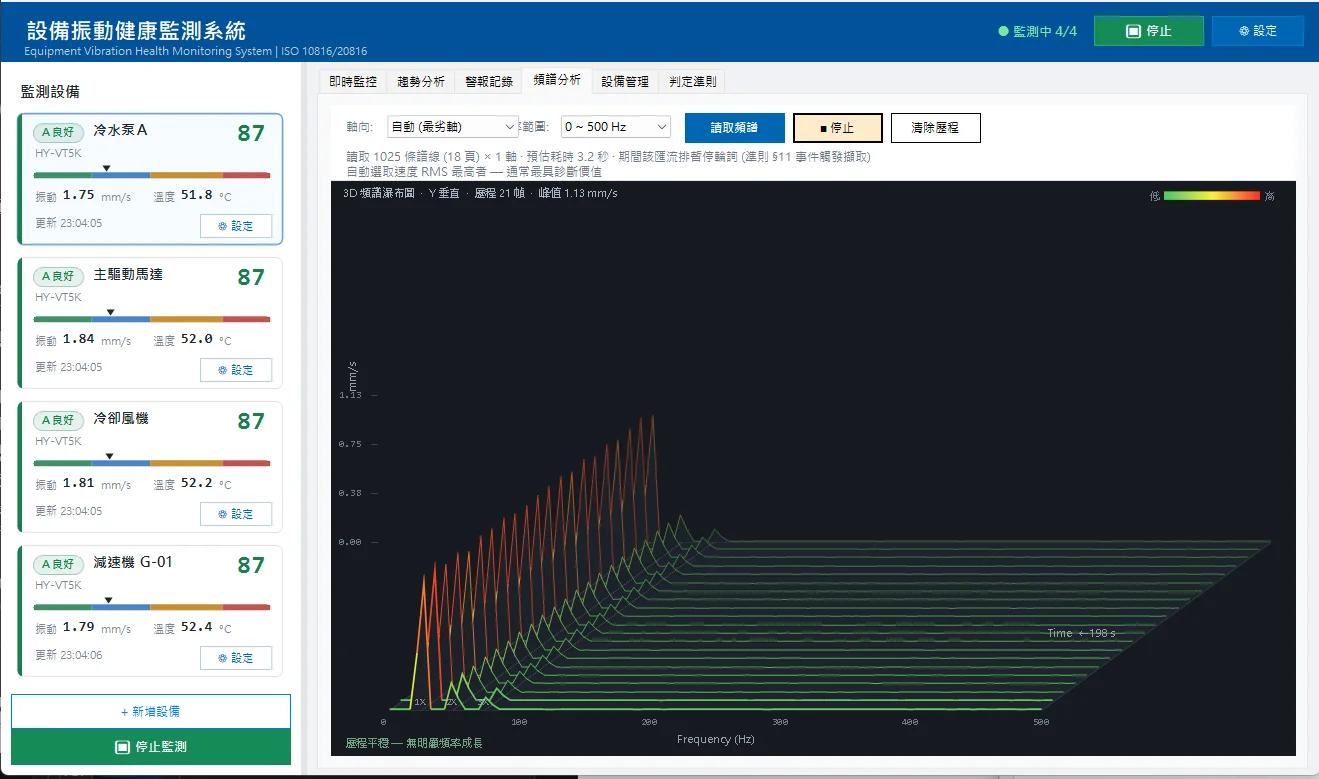
Spectrum capture is on demand, not continuous polling
Spectral data is far larger than feature values. Reading 1025 spectral lines by paged transfer takes about 3.2 s, during which polling on that RS-485 bus is suspended and then resumes automatically. The design keeps routine monitoring on a stable update period and spends bus time only when diagnosis calls for it. The interface states the expected duration and scope of the interruption before it starts, rather than leaving an operator to wonder why the screen froze.
Seven ports, each with its own role
The unit has seven serial ports (6 × RS-485, 1 × RS-232) and each is assigned one of the roles below independently, so a single gateway can act as an acquisition master and as a slave to a host at the same time. Every RS-485 port has its own schedule and buffer, so one sensor timing out or dropping off does not affect the update period of the others, and a long bus can be split across ports with different baud rates.
One gateway, two jobs
The unit inherits the ETH-A2N serial device server platform, so alongside vibration monitoring it keeps the full set of data delivery and serial integration capabilities. One gateway can send verdicts to the cloud, serve an existing SCADA by polling, and keep the original serial devices transparently connected at the same time. One data stream can reach several destinations at once, with no external splitter and without giving up the existing polling architecture in order to reach the cloud.
A baseline designed in the spirit of IEC 62443-4-2
Once the gateway joins the plant network it becomes part of the security boundary. These measures are enabled at the factory and need no extra setup. Passwords are never stored in clear text on the TF card or in the internal configuration.
Accounts and login
Three-tier RBAC (administrator / operator / viewer). Passwords are stored as SHA-256 with a per-account random salt, and the default password must be changed at first login. Consecutive failures trigger a lock-out with the remaining time reported, and the login banner is configurable.
Sessions and audit
Idle timeout plus absolute timeout, with a live session list and forced logout. Login, logout, lock-out, configuration change and firmware update events are all recorded.
Configuration and firmware
Configuration is written to two slots, so an interrupted write rolls back to the last complete set. OTA updates carry a backup image and recover automatically after a failed update or power loss, and the CONFIG button restores factory defaults.
Mounting and wiring
Dimensions are 105 × 118 × 60 mm excluding terminals and DIN clip, at approximately 650 g, mounted on a 35 mm DIN rail (EN 60715) or on a wall. The metal enclosure is IP30 and for indoor use only, with an operating range of −25 to +70 °C and 5 – 95 % RH non-condensing. Power is 9 – 36 V DC at 5.4 W max; the 5-pin terminal block supports a redundant dual supply, and G is the chassis earth terminal, which should be bonded to the cabinet earth bar by the shortest route. On the RS-485 side, gateway RX+ goes to sensor M12 pin 2 (A+), TX− to pin 4 (B−) and GND to pin 3; sensor power is supplied externally, the cable shield is bonded to the connector body and earthed at one point only, and 120 Ω termination is fitted at both ends of the bus. A TF card slot (microSD up to 32 GB, FAT32) and a USB-C maintenance port are provided, with POWER, COM and ALARM LEDs and RESET and CONFIG buttons on the panel.
Want to scope a condition monitoring rollout?
Send us your machine list, existing SCADA and network layout. We will work out how many sensor points you need, how the gateways should be configured, and propose an architecture.