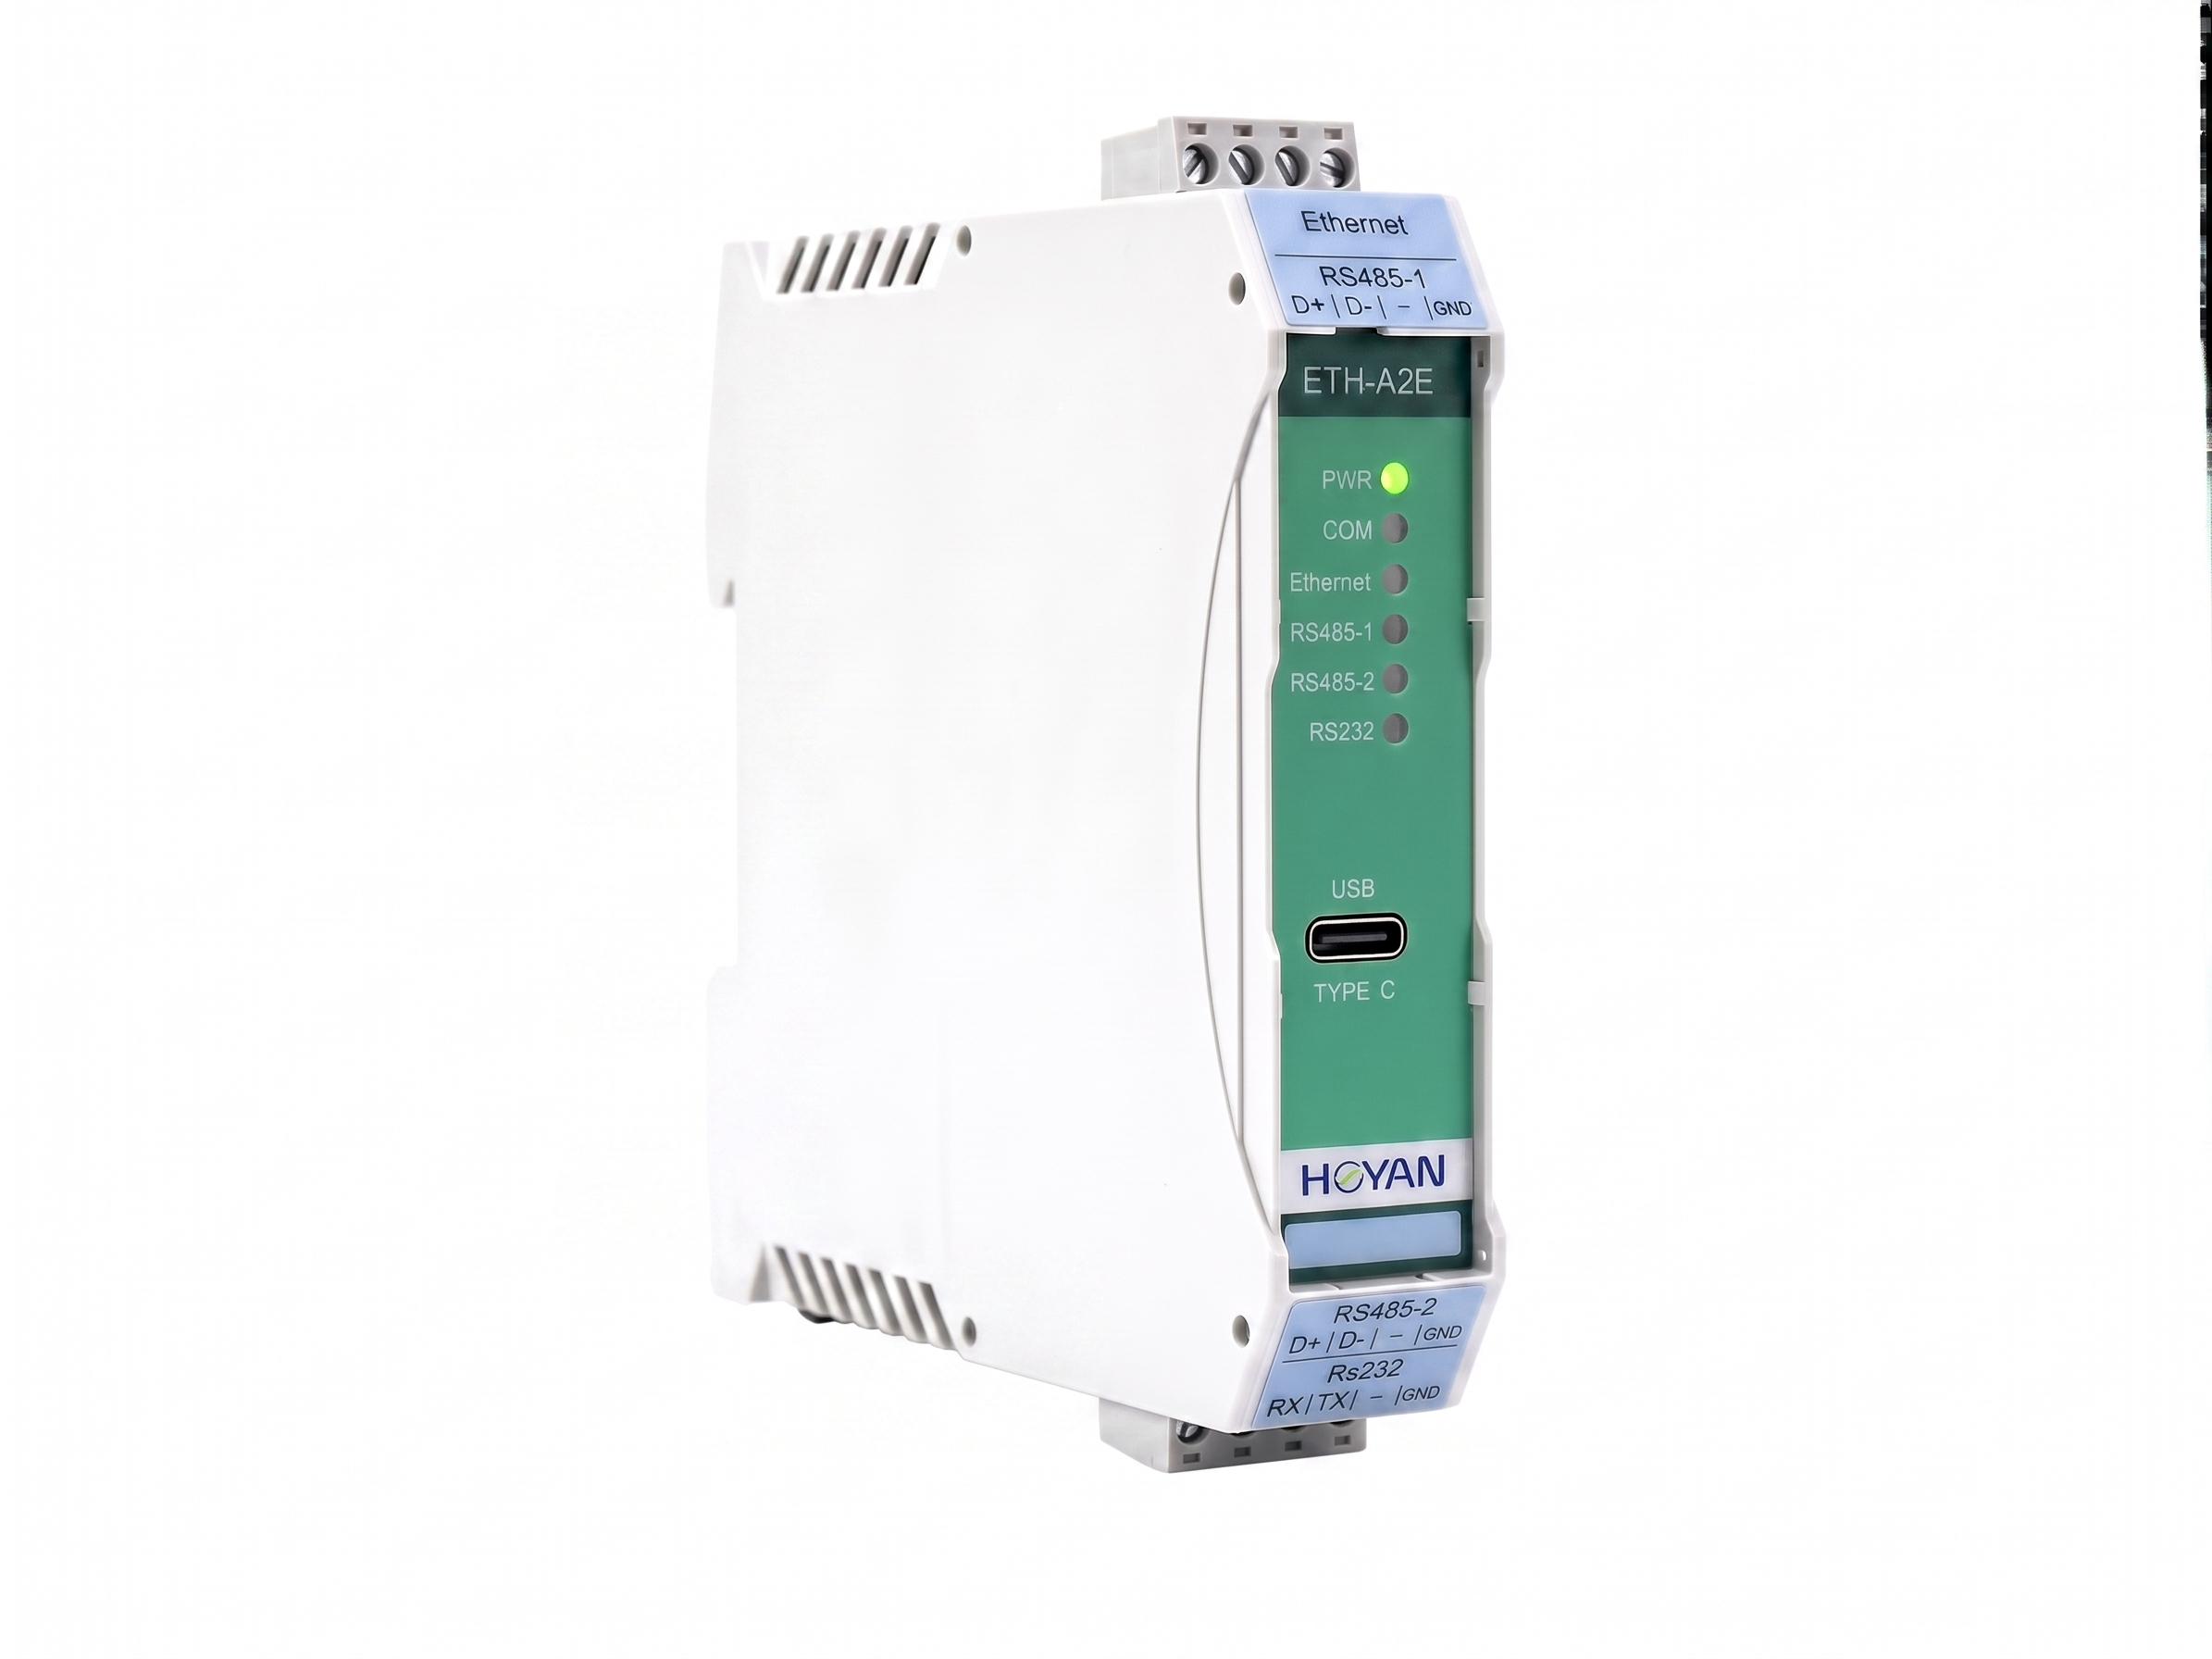
Gateway specifications
Where factory digitalisation stalls
The PLC is in place and the sensors are fitted, yet the data still stops at the panel in front of the machine. The problem is usually not the equipment itself but everything in between.
Three layers, one data path
Data takes a single route: field to gateway to system. No industrial PC in between, and not a line of code to write.
One device replaces three in the cabinet
The common arrangement today needs three: a remote I/O module that only collects points and cannot compute; a small controller that needs ladder logic and a site visit for every change; and a serial device server that forwards packets without understanding them. Three units, each configured, powered and mounted separately. ETH-A2E folds all three jobs into one — one slot, one configuration, one thing to maintain.
Three boxes become one
I/O acquisition, edge logic and serial integration in a single unit. Less cabinet space, less wiring, fewer spares — and two fewer devices to check when something goes wrong.
Control survives an outage
Logic runs on site rather than on a host PC. When the network drops, control continues uninterrupted and data is backfilled once the link returns.
Everything in a browser
100% web-based configuration with no utility software to install. Commissioning is done from a phone or laptop on site, not from a dedicated program back at the office.
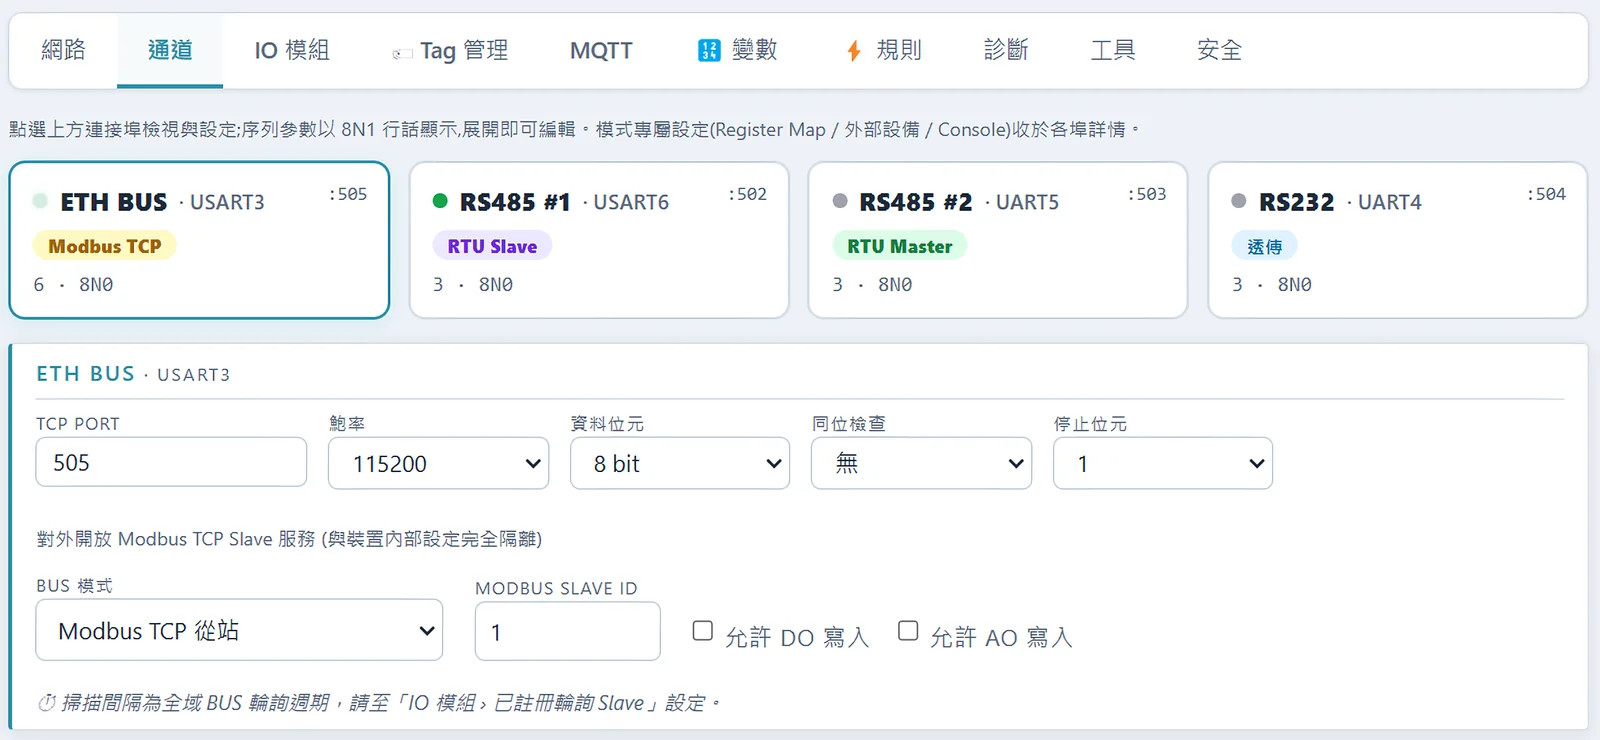
Three serial ports, configured on one page
Two RS-485 ports plus RS-232, each switched independently in the browser between RTU master, RTU slave, transparent and console — no reboot and no jumpers to move. As an RTU master it reads meters, drives and PLCs as soon as they are connected, with no changes to their programs. Registers read back are mapped into a single holding-register image, so MQTT, the rule engine and the dashboard all draw from one place instead of being configured three times.
Control logic without writing code
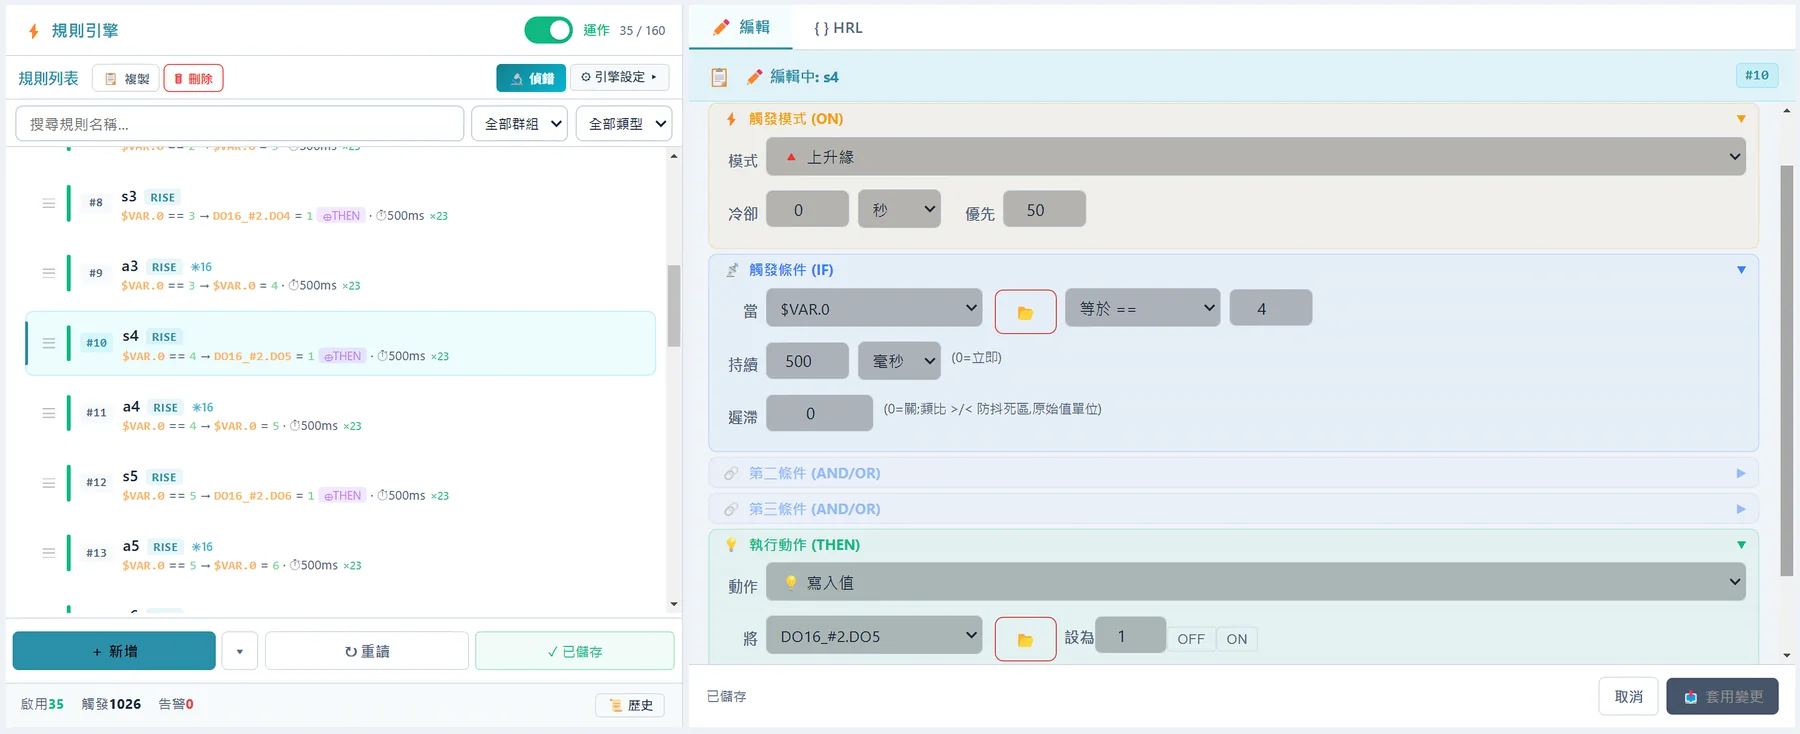
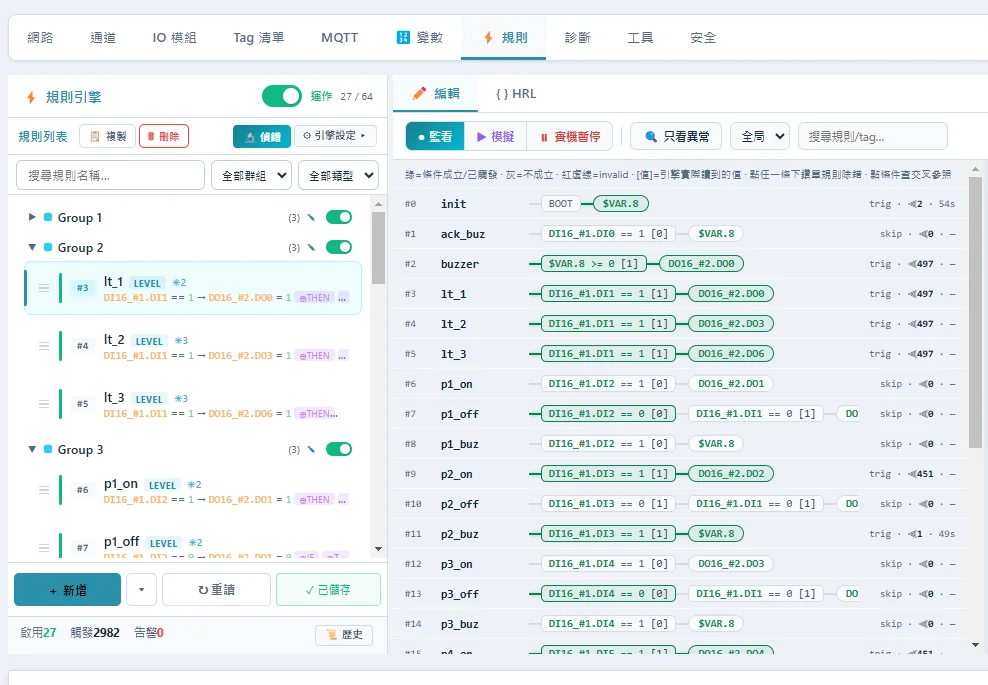
IF-THEN conditions and actions are configured by drag and drop in the browser, and 160 rules execute on a deterministic 20 ms scan. Deterministic means each scan cycle is predictable — adding rules does not quietly make alarm response times impossible to promise.
Describe the requirement, get an importable rule file
Not sure how to express a rule? Describe it online first. What comes back is checked line by line by the deterministic validator before it is downloaded and imported.
The logic is on site, not in the cloud
Rules execute on the gateway itself, independent of a host PC and of the network. With the host powered down or the link cut, interlock and alarm logic keeps running; when the connection returns it resumes automatically, leaving no gap in the SCADA or cloud record.
Runs on its own
Control decisions do not make a round trip to the cloud. What has to act still acts during an outage, which is the main reason for putting logic in the field.
Standard protocols
An existing SCADA or HMI reads directly over Modbus TCP with no middleware. MQTT 3.1.1 is standard, so AWS IoT, Azure IoT and HiveMQ all connect.
Timestamps that line up
NTP and GPS time synchronisation are supported. Events from different sites have to sit on one timeline for after-the-fact review to mean anything.
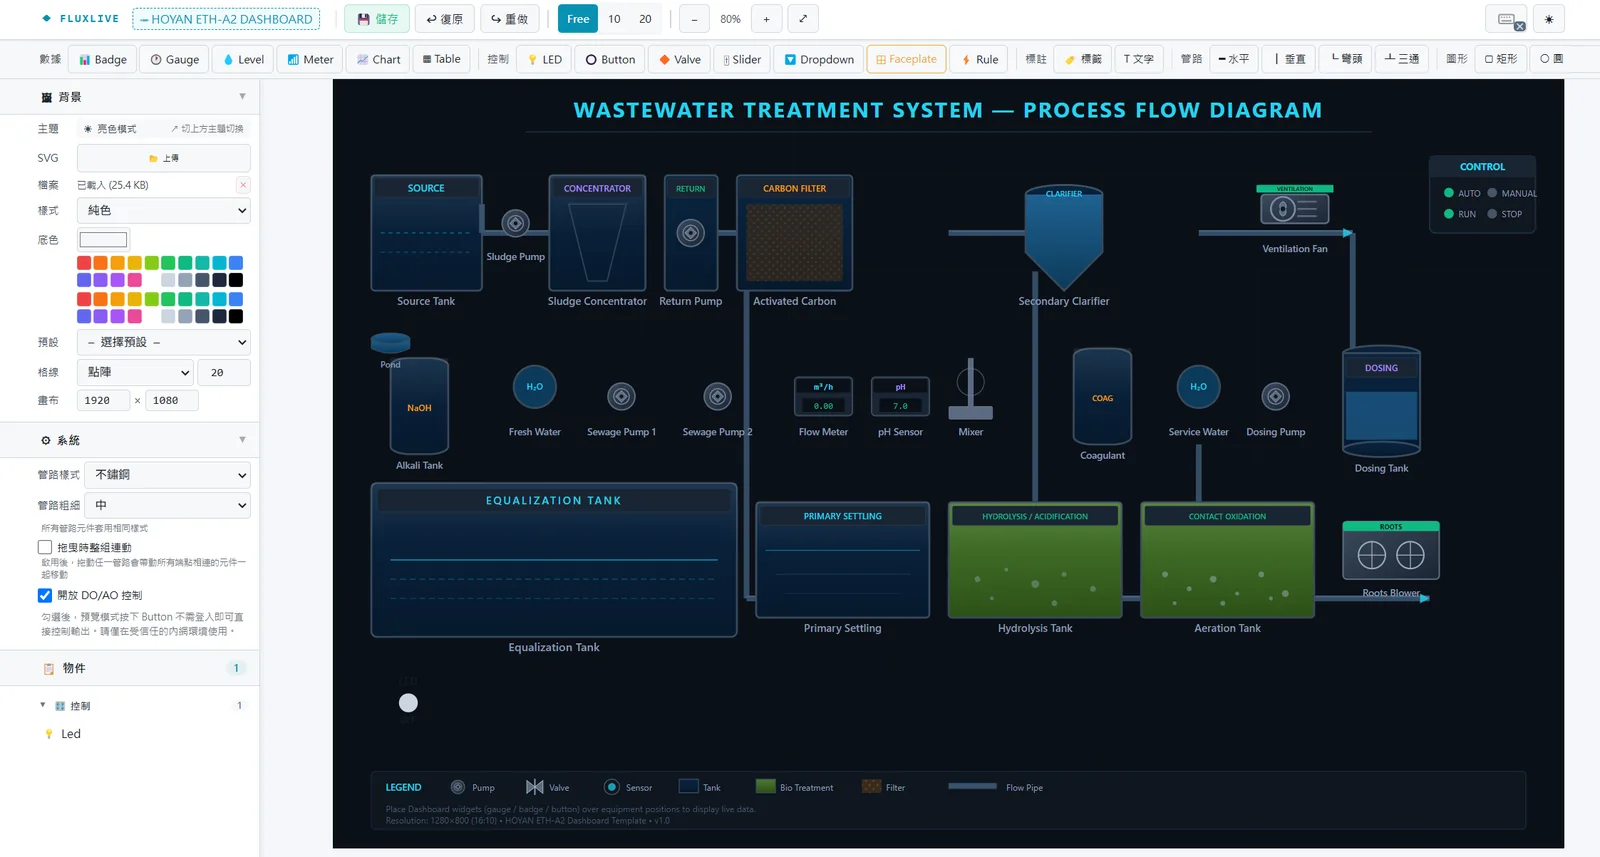
Upload an SVG and your engineering drawing becomes the operator screen
Engineering drawings, P&IDs and plant layouts serve directly as the background. Upload the SVG, drag components onto it, bind them to tags, and the screen goes live — no HTML to write and no SCADA licence to buy. The screen is theirs, not a template, and a customer recognises their own plant at a glance. Layouts are stored in the device, so a unit swap does not mean rebuilding them.
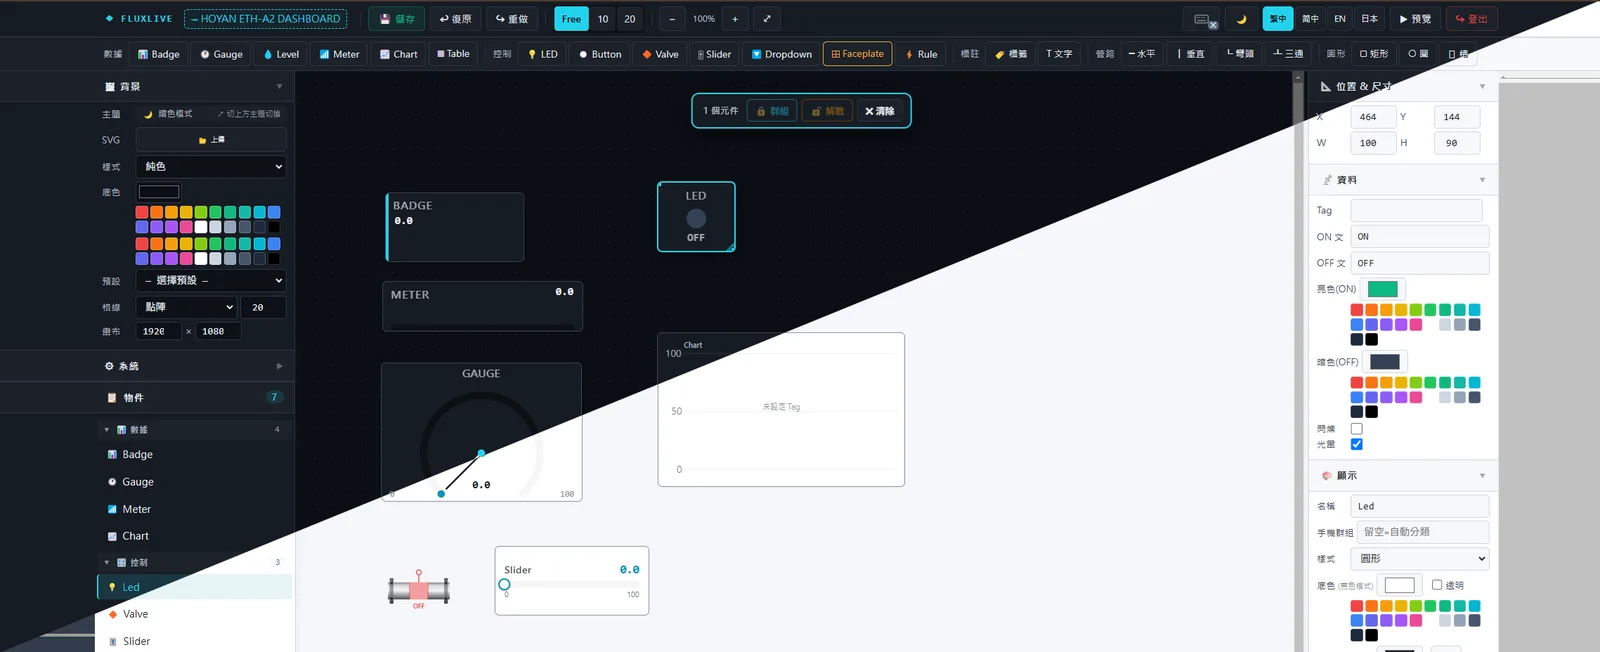
Dark and light themes, four UI languages
A dim server room and a bright plant floor need different contrast, so the theme switches with one click, which matters on a 24-hour watch. Switching does not mean rebuilding the screen — the same components and tag bindings simply change colour, so there is no second layout to maintain. The interface is available in Traditional Chinese, Simplified Chinese, English and Japanese, ready for export machinery on handover.
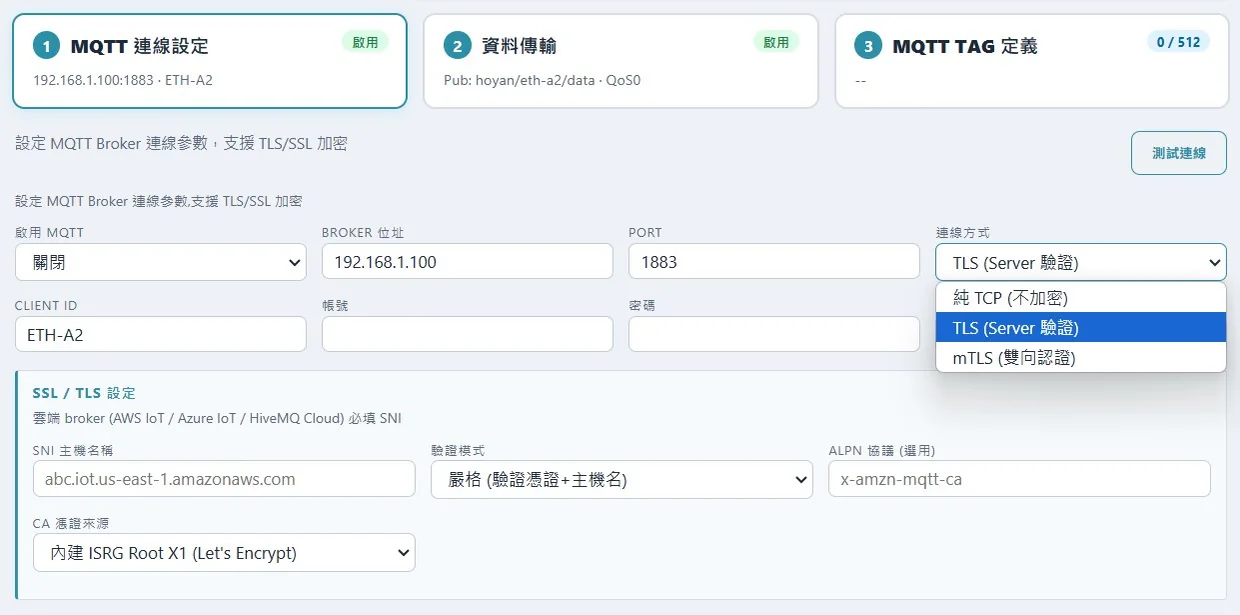
Security is the price of entry
Customers now ask before they buy. Three encryption modes cover whatever the broker requires, and the HTTPS certificate can be self-signed or a real CA certificate, which removes the browser warning.
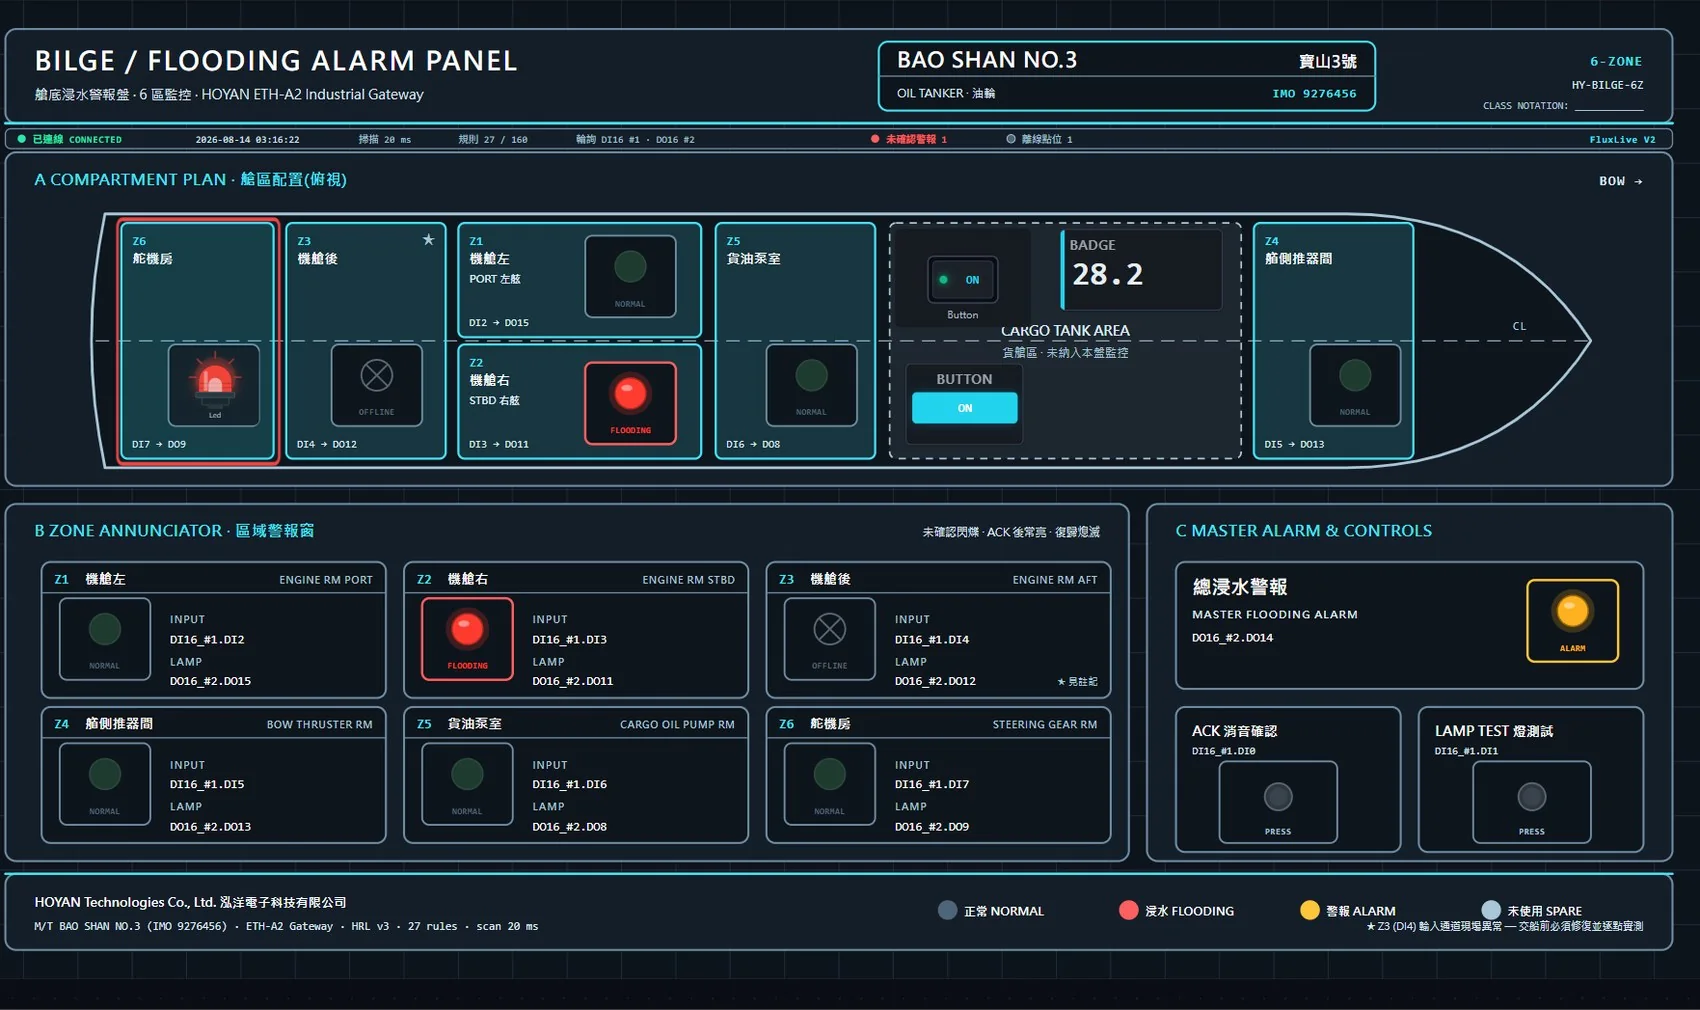
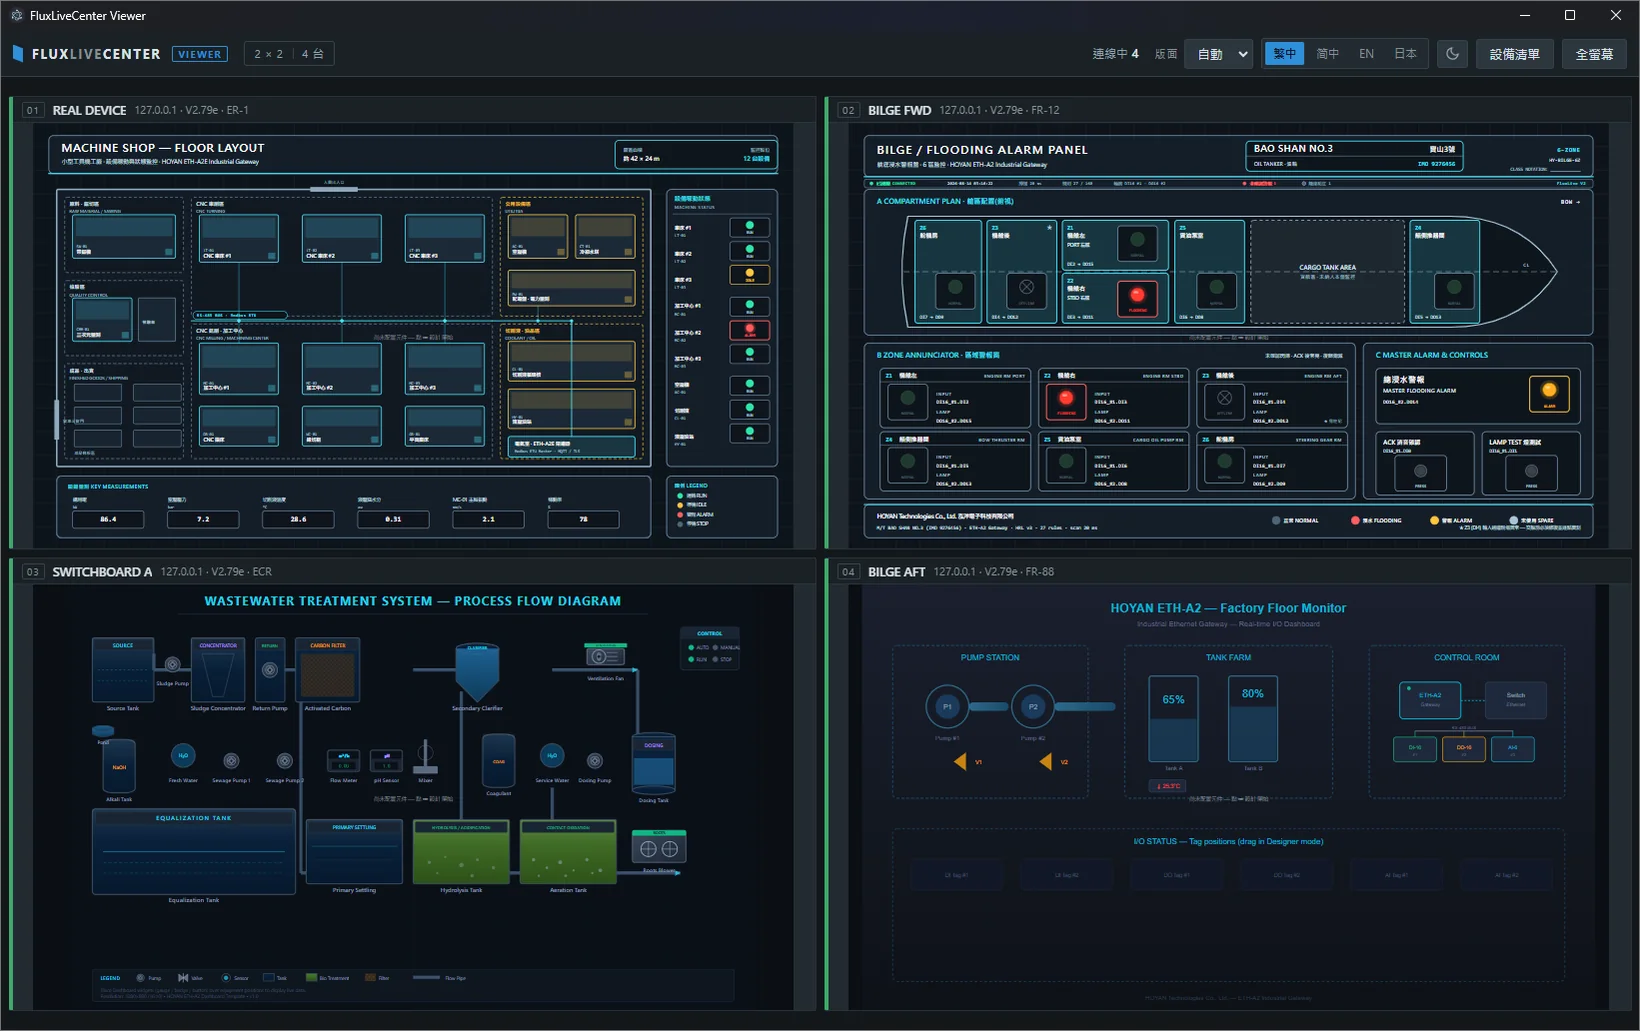
A bilge alarm panel moved into the browser
It began as a physical alarm panel: lamps, a buzzer, a mute button and relay logic. The DI/DO now runs to an ETH-A2E, the panel is reproduced in the browser, and the logic lives in the rule engine. Six compartments are monitored — engine room port and starboard, engine room aft, cargo oil pump room, bow thruster room and steering gear room — with flooding detection, lamp interlocks, mute acknowledgement and lamp test all handled by rules.
Many gateways, one control room screen
FluxLive on the device, FluxLiveCenter in the control room. The same screens and the same tags — the field and the control room are looking at the same thing, and nothing has to be rebuilt centrally.
Digitalisation without rebuilding what is already there
Before: every machine stands alone with its data trapped on the panel; signals between buildings need cable and a shutdown to install; the state of the floor is recorded by hand and cannot be reviewed afterwards; faults are found by someone walking past. After: serial devices go online the moment they are connected, with their programs untouched; scattered points are bridged over LoRa with an ETH-A2L and no cable at all; points are logged continuously at second resolution and can be replayed; thresholds raise alarms and push notifications automatically. Nothing is replaced and no existing control program is modified, which keeps the cost of adoption manageable.
Want to check whether your control logic fits the rule engine?
Describe the logic to us, or try the online HRL rule generator. We can also help size the I/O point count and module configuration.